11-14 ECOBOOST F150 3.5 TUNING OVERVIEW
Initial Thoughts and Concerns

In the upper RPMs the power just seemed to fall off and boost definitely faded. There was also some decent delay in throttle response; which takes some of the fun out of driving this truck. The lack of throttle response was expected. Fords these days all seem to have the same sluggish feeling that we are used to fixing with MPT custom tunes.
The shift schedule on the other hand, just doesn't seem to match the performance of the truck. This truck is powerful and the turbos just love to spool up, but it always feels like it's in a rush to shift. Whenever the truck is over 40mph it tries to be in 6th gear. This drops the rpms very low and leads to poor throttle response and some rather annoying gear kick downs. Later, we also found that the throttle blade was closing significantly even with your foot to the floor.
SCT Preloaded Tunes

MPT Tuning Round 1
How can we improve over the stock Ford calibration and the preloaded SCT calibrations?With the first round of MPT tunes, we had a few goals in mind. We wanted to take care of the low rpm shift points, the sluggish throttle response, and increase the power output beyond SCT's preloaded tunes.
We were able to improve the throttle response pretty easily, giving it our signature electronic throttle control twists that have worked well since 2005. Shifting was somewhat straight forward as well however we were finding the throttle blade closing and boost control issues more difficult.
We were able to get torque and initial boost really high. We made some insane amounts of torque, close to 600 ft lbs to the wheels. Then the throttle would close and the fuel pump would again struggle to keep up.
MPT Tuning Round 2
This time our biggest priorities were to keep the throttle blade open, limit the fuel pump dip, and raise peak horsepower from 4k rpm to redline.Unfortunately, it seemed like every time we'd fix one of these things, it was like a game of whack-a-mole and one of the other two would get worse. Boost would look great, torque was awesome, horsepower at the end of the RPM range was doing good, but right in the middle of the RPM range the fuel system falls to scary low rates.
We were so close to being done, but due to the fuel system restrictions we were finding a wall we couldn't get past with the current tuning method. Definitely not a tune we could release to the public. Fast forward to now, we have a tune doing everything we would like within the limits of the stock fuel system.
Present Day Released Versions

Not surprising in the least with this type of setup, we found that air charge temps affect performance. One day at the track our downstream, IAT2, air temps before launching were 160°, and once we got moving the lowest they dropped was to 120°. Then they quickly rose again with coolant temp reaching upwards of 160-165 degrees during our ¼ mile run. We knew we were pushing the efficiency limits of the stock turbos and we also knew a better intake, intercooler, and a lower degree thermostat were in our near future.
Features of the Performance Tune
The throttle body and air fuel are doing exactly what we want them to do. We ended up going way deeper into calibrating the shift points. The more and more we drove the truck, even tuned, it just didn't feel right. After a recent drive in a Turbo Mustang with a manual transmission it finally clicked what was missing.Performance vehicles making this much horsepower and torque are usually manual trans, so we decided to calibrate the trans schedule to hold the gears as if you were driving stick. We could increase the base level of performance without even putting the pedal to the floor. Our 93 Performance Race tune netted us a respectable timeslip of 13.86 at 98.87mph in the quarter mile with a stock run on the same day pulling a 14.74 at 94.51mph. This was with ambient temperature of about 85° and 75% humidity. Our Crew Cab being 2WD doesn't help with track times and neither does our 3.55 rear end, combine that with factory tires and getting a good 60' is near impossible. We made it a point to resist temptation to modify the truck to insure good track times with only a tune. We were definitely happy with the 9/10th improvement over stock.

With how easy this truck gets hot, we wanted to see what sort of power it makes when already pretty hot, so we started with a stock tune with the speed limiter removed and netted 278hp and 328 ft/lbs of torque at the wheels, but power fell off pretty quickly after 5k rpm. A good majority of that is due to the super rich fueling during cat over temp mode.
SCT's preloaded tune was still able to increase power even under extremely hot conditions of our non-air conditioned, hot dyno room in Central Florida. This tune increased power to 307hp and 417 ft/lbs of torque at the wheels, respectable numbers indeed.

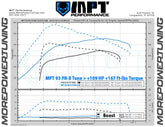
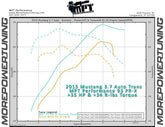
So you could imagine how excited we were when our base 93 Performance Race tune laid down a consistent 382 horsepower and 463 ft-lbs of torque at the wheels while heat soaked. (more power on final tune) The boost curve was solid with 19-20 psi peak and a slow taper down to our redline boost target. We gained a solid 100 horsepower and almost 140 ft-lbs of torque with consistent gains throughout the entire RPM range.
Part of this success was by fine tuning the computer to control spark advance based on air charge temperature. There were sessions where we made over 60 dyno pulls in one day. Watching and recording everything.
Interpreting a Dyno Graph
Let's take a moment to get to know our dyno and how we interpret the data it delivers. A dyno is nothing more than a tool, simple as that. Our choice here at MPT is a Dynocom 15000 Load Bearing Chassis Dynomometer. We chose this dyno for several reasons, most importantly because it allows us to apply load to the rollers to simulate real on-road driving scenarios. Not only does this help ensure excellent driving manners when we finish a tune, but it is almost a requirement with turbocharged engines to accurately assess when the turbo(s) will spool and exactly how much boost they will make. Also, being able to accurately simulate road-load allows us to insure that any ignition timing changes we make are both safe and effective.Now that we know how that data is collected, let's talk about how we interpret it. There are many variables that come into play when measuring power on a dyno. Ambient temperature, relative humidity, engine coolant temperature, air charge temperatures, tire diameter, transmission and axle gear ratios are just a few of the factors that will impact the results of the dyno graph.
Essentially it's completely possible to have two vastly different dynographs made from the same vehicle, running the same tune, depending upon the conditions. That being said, when reading a dynograph the most important thing to look for is a baseline from the same day to compare against. Once the baseline has been established you can accurately determine the gains of a tune. So, while peak numbers make for great banter, they don't really tell the whole story. The best approach here is to determine the PERCENTAGE GAIN increase over the baseline. All it takes is a little simple math.
Simply divide the new power output by the baseline power output to determine the percentage increase. For example, if our baseline made 300 RWHP, and our new tune made 450 RWHP, the math would look like this: 450/300= 1.5 or a 150% increase in power output. This formula can be used throughout the entire dynograph to determine where the largest gains occurred. So, just like us, you should be leery of internet dynographs that are posted up that don't show an accurate baseline for you to compare against.
MPT Performance Race

- Truck pulls hard and feels way lighter
- 6-8psi Boost Increase at WOT (Peak: 20-22psi / Avg stock 11-14psi) (Boost intentionally dropped at high rpm to limit air temps and increase hp)
- Improved Throttle Response
- Faster 0-60
- Low end torque and acceleration
- Shift Points focused on Performance, keeping the truck in the best rpm range for quick acceleration when needed
- Better fuel economy (When driven conservatively, 1-2mpg gain avg)
- Race is the firmest, fastest shifting tune.
- Torque Reduction is almost fully disabled to allow a very quick alert shift between gears.
- Part Throttle and WOT shifts are quick and firm, most likely chirping the tires on the 1-2 shift and possibly the 2-3 shift
- Shift Points are much later than stock, holding the gears longer and preventing upshifts at low speeds/rpm.
- In stock form, most all driving is in 6th gear, on our Race tune; all gears are used to their proper range.
- The Performance Race tune has been described as shifting as if you were driving a manual transmission.
- Very strong low end acceleration and high rpm pulling horse power.
- Most throttle response out of all the tune choices.
- Special feature on Performance Race: Clicking the tow-haul button transforms the shifting into a performance/economy profile allowing shifts into higher gears at lower mph.
MPT Performance Street

- Truck pulls hard and feels lighter
- 4-8psi Boost Increase (Avg for Street 16-18psi / Avg stock 11-14psi)
- Improved Throttle Response
- Faster 0-60
- Low end torque and acceleration
- Shift Points focused on Performance, keeping the truck in the best rpm range for quick acceleration when needed
- Better fuel economy (When driven conservatively, 1-2mpg gain avg)
- Torque Reduction reduced to allow a fuller feeling shift with less delay between the gears.
- Street option increases shift firmness approximately 40% over stock.
- Part Throttle and WOT shifts are quick and firm, most likely chirping the tires on the 1-2 shift.
- Shift Points are later than stock, holding the gears longer and preventing upshifts at low speeds/rpm.
- In stock form, most all driving is in 6th gear, on our Street tune, all gears are used to their proper range.
- The Performance Street tune has been described as shifting as if you were driving a manual transmission.
- Strong low end acceleration and high rpm pulling horse power.
- Special feature on Performance Street: Clicking the tow-haul button transforms the shifting into a performance/economy profile allowing shifts into higher gears at lower mph.
MPT Towing Tune

- Focused specifically on towing
- 2-3psi Boost Increase (Avg Towing 14-16psi / Avg stock 11-14psi)
- Improved Throttle Response
- Faster 0-60
- Low end torque and acceleration
- Shift Points focused on Towing, keeping the truck in the needed gear for pulling power and climbing hills
- Increased engine braking while descending to extend brake life span
MPT Truck
FAQ:
What should I set my spark plug gap at?
The recommended spark plug gap on all tunes including stock is .028-.032. For higher boost tunes run the lower gap. It’s also a good idea to change plugs a little more frequently than recommended in the owner’s manual, especially on more aggressive tunes. 6,000 miles should be the max interval between changes on a truck that is driven hard, regularly, on our street tune and above. Plugs are cheap…. “When in doubt… change them out!”
How much time will the custom tunes take to build?
Custom Tunes are completed in order they are received. Typical turnaround time is approx. 3 business days, but times may vary.
Need your tunes ASAP?
About Our Truck
MPT owns a 2012 F150 Ecoboost 3.5L. Most of our tunes were developed on this truck while it was completely stock. We use an SCT Livewire TS to program the vehicle and monitor vital stats on the road. Recently, we’ve begun testing more popular modifications.

